このページでは、過去に実施した施策の効果検証などに使える差分の差分法(DID)とCasual Impactについて解説します。
適切な非介入群を用意することが難しくABテストが実施困難な場合にも使える方法です。
施策の効果検証方法
何らかの施策の効果検証を行う方法としてABテストが代表的ですが、ランダム化比較試験(RCT)により実験を行うこと自体が難しかったり、できたとしても再現性を確保することが難しいという課題があります。
そのような場面でも、回帰分析や傾向スコアを用いた分析を行うことで介入群と非介入群を比較することができます。
しかし、現実には全てのユーザーに対して一律に割引セールを行う事例もあり、実施済み施策の効果検証を行う際に二群に分けた比較を行えない場合もあります。
このような場合には、Prophetなどの時系列予測を行う方法と差分の差分法(DID)やCasual Impactを使う方法があります。
時系列予測を行う方法では、当該データの施策実施前期間の売上を元に施策実施期間の売上を予測し、予測値と実績値の差分を施策の効果とみなす方法です。
DIDやCasual Impactでは、まず施策実施前期間について他地域の売上を元に当該地域の売上を予測するように学習してモデルを作成します。
このモデルを使って、施策実施期間中について他地域(施策未実施)のデータから当該地域の「施策を実施しなかった場合の売上」を予測します。
時系列予測同様に、予測値と実績値の差を施策の効果とみなします。
このページでは、後者(DIDとCasual Impact)について紹介します。
差分の差分法(DID)

差分の差分法(DID, Difference-in-Differences)は、施策を実施した介入群について、施策を実施しなかった場合の値を求める手法です。
DIDにおける介入群と非介入群は、ABテストとは異なり、同質なサンプルである必要はありません。
このように、介入群と非介入群の中に同質のサンプルが存在しなくても実施できるのがDIDの利点です。
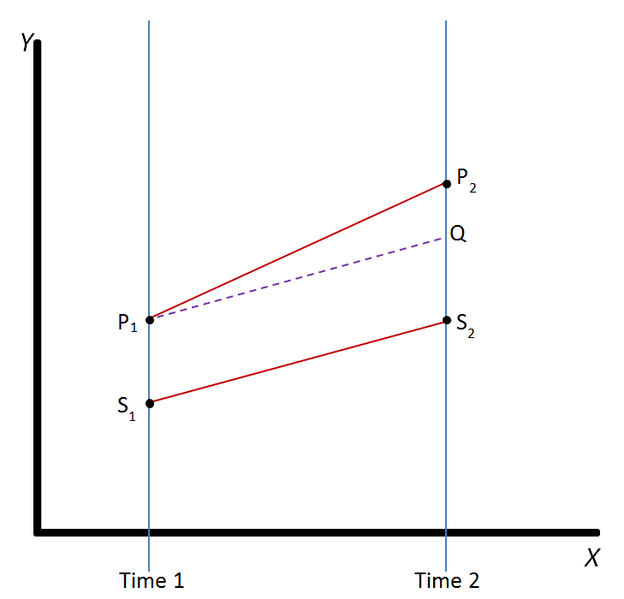
DIDでは、介入群においても、もし施策を実施しなかったら非介入群と同じように推移するという平行トレンド仮定を置きます。
上図の例では、施策実施前(Time 1)と施策実施後(Time 2)の2つの時点における介入群(P)と非介入群(S)のデータから、介入群において施策を実施しなかった場合のTime 2時点での値(Q)を求めています。
非介入群の施策前後の推移(S1→S2)を元に平行トレンド仮定により、介入群が施策を実施しない場合の推移(P1→Q)を求めます。
このようにして、介入群において介入を行わなかった場合のTime 2時点の値Qを求め、介入した実際の値P2との差分を施策の効果とみなします。
DIDの欠点としては、前提条件である平行トレンド仮定を満たす非介入群を見つけるのが大変だということです。
平行トレンド仮定を本当に満たすかは、データからは直接確認できません。
施策実施前期間のデータを長く取れる場合は、その期間のデータのトレンドがPとSで類似しているかで確認できますが、比較対象として使えるデータが揃っている非介入群が都合よく得られるかという課題があります。
Casual Impact
Casual ImpactはDIDの欠点を改善した手法であり、介入が行われたサンプルの「もし介入を行わなかった場合の値」を他のデータから補う方法です。
Casual Impactでは、施策実施前期間のデータを使って非介入群のデータから介入群の値を学習し、施策実施期間における「施策を実施しなかった場合の値」も予測するという方法です。
Casual Impactによって予測した値(施策を実施しなかった場合の値)と実際の値(施策を実施した場合の値)の差分を施策の効果とみなします。
Casual Impactにおいては、介入群の値をきちんと予測できるような変数を投入できるかが鍵となります。
予測がうまくいくのであれば、どのようなデータであっても非介入群として置くことができるのがCasual Impactのメリットです。
Casual Impactでは、まず施策実施前期間のデータを使って非介入群について得られる様々な種類の変数(説明変数)から介入群の値(目的変数)を学習してモデルを作成します。
学習に使用する説明変数については手動で選択する必要はなく、RやPythonでCasual Impactの関数を実行すれば自動的に変数を決めてモデルを学習します。
学習したモデルは施策を実施していない期間のものなので、施策実施期間に対して予測した結果は、「施策を実施しなかった場合の値」となります。
このため、実際のデータ(=施策を実施したデータ)との差を比較することで、施策の効果検証ができます。
事例:CA大規模禁煙キャンペーンの効果検証
Casual Impactによる施策効果検証の例として、カリフォルニア州で行われた大規模な禁煙キャンペーンがたばこの売上に及ぼした効果の検証を行います。
データはRのEcdatパッケージのCigarデータセットを使います。
Rでのコードは以下のとおりです。
# 分析用にEcdatからCigarデータを取得
install.packages('Ecdat')
library('Ecdat')

# 確認用
data(Cigar)

# データの出力
out_path = '../02_work/01_dataset/01_cigar.csv'
write.csv(Cigar, out_path, row.names = FALSE)
次に、Cigarデータセットを使ってPythonでCasual Impactを行います(Rでもできます)。
以下は、Google ColabにてPythonのtfcausalimpactパッケージを使って実装したコードです。
なお、Casual Impactではパッケージにより結果が一致しないという問題ので注意が必要です(下記リンク先を参照)。
参考:CausalImpactは実装によって中身に重大な差異がある 渋谷駅前で働くデータサイエンティストのブログ 2025/1/1閲覧
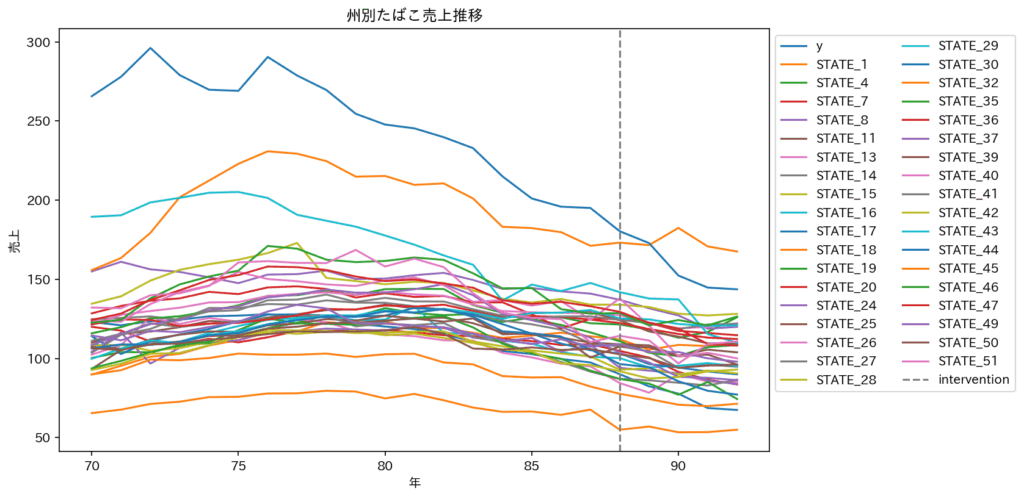
はじめに、州別のたばこ売上推移を可視化します。
from google.colab import drive
drive.mount('/content/drive')

# 必要なパッケージのインストール
!pip install tfcausalimpact pandas==1.5.0 numpy
# matplotlibでの日本誤文字化け対策用
!pip install japanize-matplotlib

import pandas as pd
from causalimpact import CausalImpact
import matplotlib.pyplot as plt
import japanize_matplotlib

# データの読み込み
file_path = '../02_work/01_dataset/01_cigar.csv'
df_raw = pd.read_csv(file_path)

# 1988年以降にたばこ税が50セント以上上昇した州を除外
skip_state = [3,9,10,22,21,23,31,33,48]
df = df_raw[(~df_raw['state'].isin(skip_state)) & (df_raw['year'] >= 70)]
df = df.reset_index(drop=True)

# 目的変数
# カリフォルニア州の売上のみを抜き出す
y = df[df.state == 5][['year', 'sales']]
y = y.set_index('year')
y.columns = ['y']

# 説明変数
# カリフォルニア州以外の州の売上データを抜き出す
df[df.state != 5][['year', 'state', 'sales']]

# 説明変数について、売上が州ごとに1カラムとなるように横持ち変換
df_other_usecol = df[df['state'] != 5][['year', 'state', 'sales']]
X = pd.pivot_table(df_other_usecol, values='sales', index='year', columns='state')
# カラム名を州番号だけではなくPrefixをつける
X = X.add_prefix('STATE_')

df_ci = pd.concat([y, X], axis=1)

# #########################################
# 州別売上推移の可視化
# #########################################
fig, ax = plt.subplots(figsize=(10, 6))
columns = df_ci.columns
for column in columns:
    ax.plot(df_ci.index, df_ci[column], label=column)
# 88年に破線のラインを追加
ax.axvline(x=88, color='gray', linestyle='--', label='intervention')
title = '州別たばこ売上推移'
x_lab = '年'
y_lab = '売上'
ax.set_title(title)
ax.set_xlabel(x_lab)
ax.set_ylabel(y_lab)
ax.legend(loc='upper left', bbox_to_anchor=(1, 1), ncol=2)

# 画像の出力
save_path = '../02_work/02_CI実行_CA禁煙キャンペーン効果検証/02_州別売上推移.png'
plt.savefig(save_path, dpi=150, bbox_inches='tight')

plt.show()
可視化した結果はこちらです。

次にカリフォルニア州以外の州のデータを利用してカリフォルニア州の禁煙キャンペーンの効果検証を行います。
# #########################################
# Casual Impact
# #########################################
# indexの年を削除して0からの通し番号にする
# (pre_period, post_periodの行番号が施策実施前/後期間のデータに合致するように)
df_ci = df_ci.reset_index().drop(columns=['year'])

# 介入前期間と介入後期間をindex番号で指定
pre_period = [0, 17]
post_period = [18, 22]

# 施策実施前/後の期間をindex番号で指定してCasual Impact実施
ci = CausalImpact(df_ci, pre_period, post_period,
                  model_args={'fit_method': 'hmc'})
ci.plot()
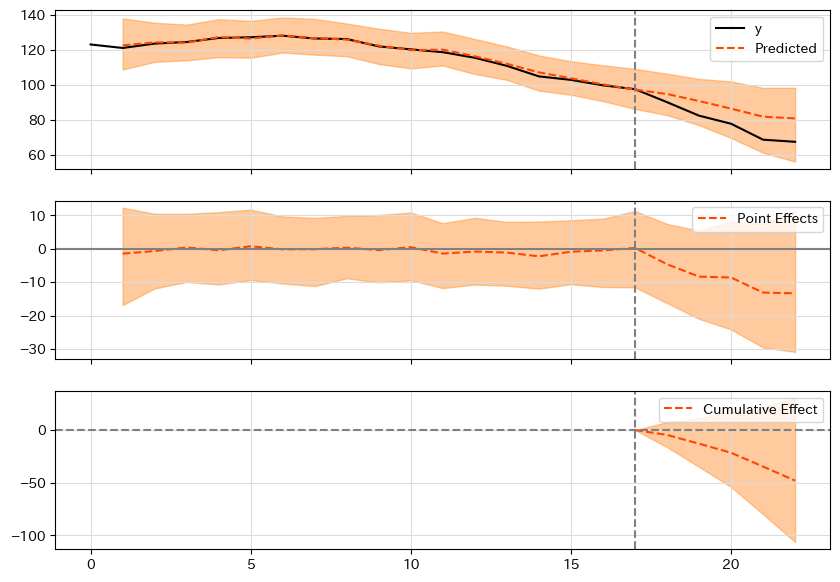
Casual Impactを実施すると、plot関数で可視化した結果を見ることができます。

Casual Impactによる効果検証結果は、summary関数で確認できます。
ci_summary = ci.summary()
print(ci_summary)
# Posterior Inference {Causal Impact}
#                           Average            Cumulative
# Actual                    77.3               386.5
# Prediction (s.d.)         86.91 (7.45)       434.55 (37.24)
# 95% CI                    [69.79, 98.99]     [348.96, 494.94]

# Absolute effect (s.d.)    -9.61 (7.45)       -48.05 (37.24)
# 95% CI                    [-21.69, 7.51]     [-108.44, 37.54]

# Relative effect (s.d.)    -11.06% (8.57%)    -11.06% (8.57%)
# 95% CI                    [-24.95%, 8.64%]   [-24.95%, 8.64%]

# Posterior tail-area probability p: 0.09
# Posterior prob. of a causal effect: 90.61%

# For more details run the command: print(impact.summary('report'))report関数で結果の解説が得られます。
ci_report = ci.summary('report')
print(ci_report)

#  Analysis report {CausalImpact}

# During the post-intervention period, the response variable had
# an average value of approx. 77.3. In the absence of an
# intervention, we would have expected an average response of 86.91.
# The 95% interval of this counterfactual prediction is [69.79, 98.99].
# Subtracting this prediction from the observed response yields
# an estimate of the causal effect the intervention had on the
# response variable. This effect is -9.61 with a 95% interval of
# [-21.69, 7.51]. For a discussion of the significance of this effect,
# see below.


# Summing up the individual data points during the post-intervention
# period (which can only sometimes be meaningfully interpreted), the
# response variable had an overall value of 386.5.
# Had the intervention not taken place, we would have expected
# a sum of 434.55. The 95% interval of this prediction is [348.96, 494.94].


# The above results are given in terms of absolute numbers. In relative
# terms, the response variable showed a decrease of -11.06%. The 95%
# interval of this percentage is [-24.95%, 8.64%].
# This means that, although it may look as though the intervention has
# exerted a negative effect on the response variable when considering
# the intervention period as a whole, this effect is not statistically
# significant and so cannot be meaningfully interpreted.


# The apparent effect could be the result of random fluctuations that
# are unrelated to the intervention. This is often the case when the
# intervention period is very long and includes much of the time when
# the effect has already worn off. It can also be the case when the
# intervention period is too short to distinguish the signal from the
# noise. Finally, failing to find a significant effect can happen when
# there are not enough control variables or when these variables do not
# correlate well with the response variable during the learning period.


# The probability of obtaining this effect by chance is p = 9.39%.
# This means the effect may be spurious and would generally not be
# considered statistically significant.グラフの結果を一見するとマイナスの効果が出たように思われますが、95%信頼区間の範囲内であるため有意差なしという結果になりました(p = 9.39%)。
参考文献
安井 翔太「効果検証入門~正しい比較のための因果推論/計量経済学の基礎」技術評論社(2020)
差分の差分法 ウィキペディア 2025/1/1閲覧
Pythonで因果推論(9)~差分の差分法(DID)による効果検証~ Zenn 2025/1/1閲覧
差分の差分法: DID 拓殖大学 2025/1/1閲覧
CausalImpact の概要と Python による実装、その評価 Zenn 2025/1/1閲覧
{CausalImpact}を使う上での注意点を簡単にまとめてみた 渋谷駅前で働くデータサイエンティストのブログ 2025/1/1閲覧
CausalImpactは実装によって中身に重大な差異がある 渋谷駅前で働くデータサイエンティストのブログ 2025/1/1閲覧